Research Work
Since I started my research career I've been involved in many projects. Here I'll
list a few of the more interesting and significant ones.
Although most of my research projects have been related to disease mapping
or spatial epidemiology, I have also worked on other applications, such as
modelling butterfly behaviour and time-series analysis.
Of course all these projects are collaborative works with many people from
all over the world - please see my collaborations page
for some credits.
I'm always interested in new collaborative opportunities - if you have
any ideas where we can work together, send
me an email or get in touch.
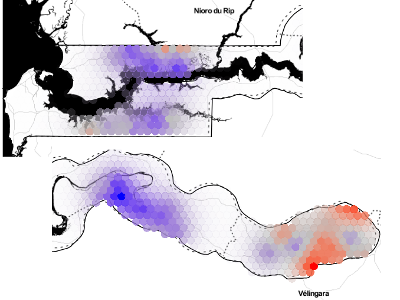
Modelling Childhood Malaria in The Gambia
Using model-based geostatistics we looked at the prevalence of
malaria in children in The Gambia. By considering the spatial autocorrelation in the
village survey data, we can come up with a model that makes meaningful predictions on the
rate of malaria based on bednet usage. This lets us answer 'what-if' questions about the effect
on malaria rates based on possible increased distribution and use of treated or untreated bednets.
This work was published in JRSS Series C
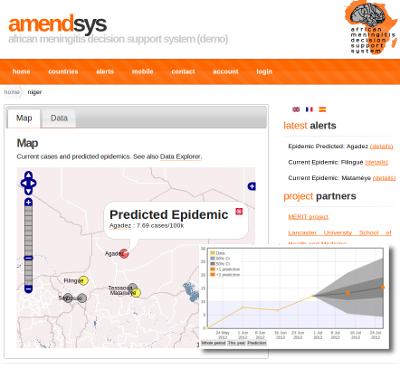
The Meningitis Belt is a wide region across several countries in sub-Saharan Africa.
We received weekly data on case counts from some of these countries, and predicted
the probability of regions going above the epidemic threshold.
A web interface was designed to act as an early-warning system of potential epidemics
and to act as a map and data browser and repository.
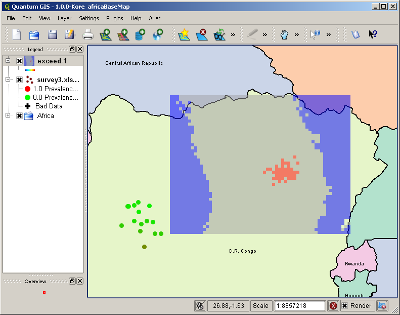
Loaloa treatment risk mapping
Treatment for River Blindness (Onchocerciasis) with Mectizan can be accompanied
by severe side-effects if the treated person is infected with Loa loa filariasis. By analysing
the joint distribution of a cheap, rapid, but imprecise survey and a more expensive, slower
laboratory testing we produced a risk map for Loa loa filariasis. This map incorporated spatial
covariates such as climate and altitude data, to produce an assessment of areas where Loa loa
is unlikely to be a problem, and areas where more sampling is required.
A plugin for the Open Source GIS, QGIS was developed
to allow for easy data entry and prediction in the field.
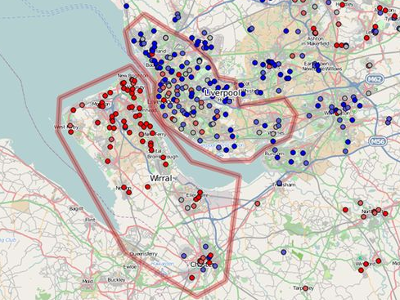
Mapping NHS Prescription Spending
The NHS began to release data on prescription medicine spending for England in 2012. We took
some of the first released data, and related this to published GP practice data to get maps
of spending. We also created smoothed maps of spending rates to look for areas where spending on
certain drugs was significantly higher than the national average.
The generated maps reveal some patterns, such as the difference in average spend per child on
Metformin, a drug licensed for ADHD treatment, on either sides of the Mersey.
The research is published under an Open Access license in BMJ Open,
and all the data is released under an Open license too.
Hospital Admissions Prediction
We are working with Alder Hey Children's Hospital to help predict emergency admissions. This
will enable them to better schedule elective procedures to make full use of hospital
resources. We will be running daily updated predictions on the current hospital configuration
and working towards implementation as the hospital expands into its new building.
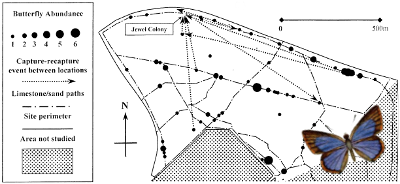
Butterfly Behaviour Modelling
The Australian butterfly Hypochrysops Halyaetus has a complex life cycle.
It lives in large colonies and has a mutually beneficial relationship with a species of ant,
and a reliance on certain plants for egg-laying and feeding.
This implies its small-scale spatial behaviour needs to be well understood for conservation planning.
We analysed butterfly captures and local spatial data to fit a model for habitat suitability with
consideration of spatial autocorrelation. This work was published in Biological Conservation.
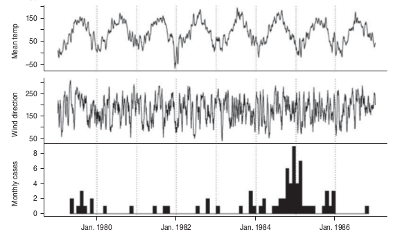
Seasonal Patterns of Legionnaire's Disease
Any phenomenon with an annual pattern is likely to have a significant correlation with
every other annually-patterned phenomenon. For example, sales of strawberries will appear correlated with childrens' emergency admissions. But we can be confident
strawberry sales aren't causing the emergency admissions, its just that children are more active in the summer and so have more accidents.
Legionnaire's Disease is known to have a seasonal
pattern, so appears correlated with weather data such as rainfall, humidity, or wind. However,
once the yearly pattern is accounted for, there is power to look for more possible causal
relationships with weather. We did this analysis for cases in Glasgow for a publication in Epidemiology and Infection.
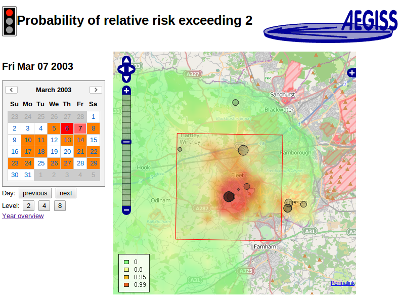
Gastro-Intestinal Outbreak Surveillance
For the AEGISS project we received daily reports of gastro-intestinal case data from
the NHS Direct helpline for Hampshire. These were modelled against expected case incidences
to produce relative risk maps. These maps were then presented in a web mapping interface with calendar and 'traffic light' controls.
A new research grant is investigating a wider roll-out of a spatial surveillance system, and is
developing re-usable tools for this.